Examples
See the examples directory on GitHub.
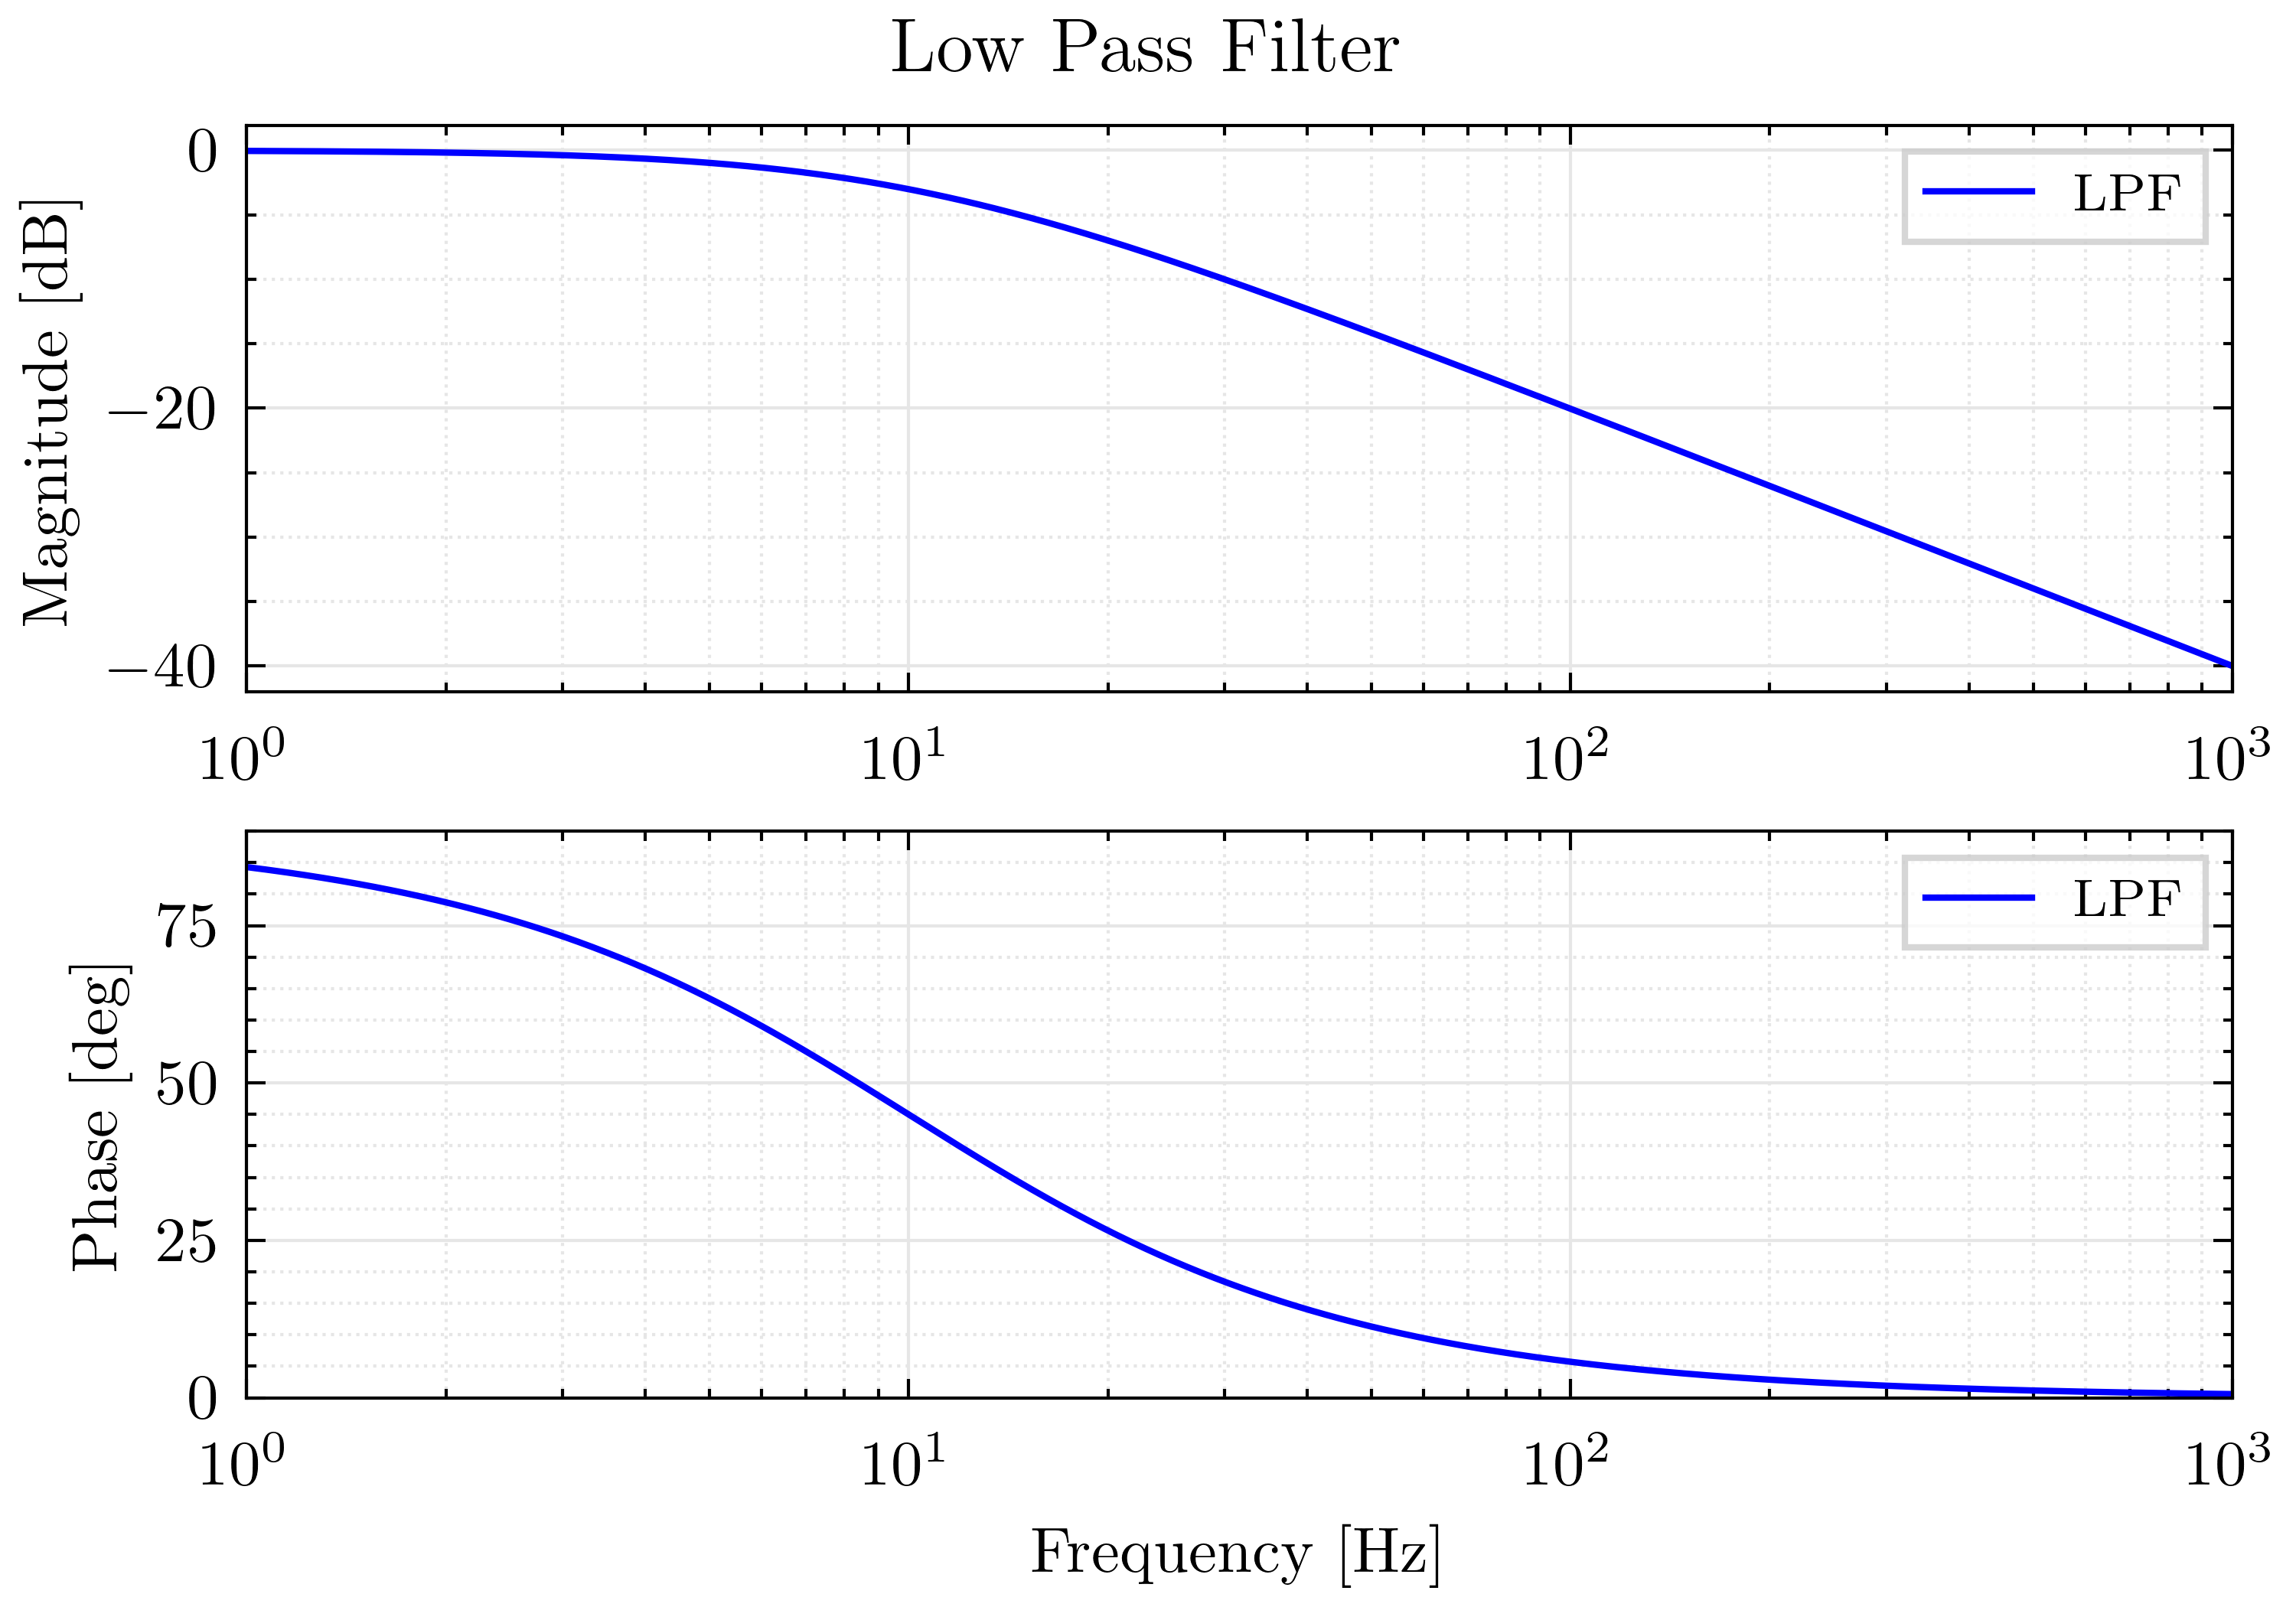
examples/bode-plot.py
import matplotlib.pyplot as plt
import numpy as np

plt.style.use("physics_plot.pp_base")


# Functions for example plot
def db(x):
    return 20.0 * np.log10(x)


def model(f):
    return 10.0 / (f - 1.0j * 10)


# figsize=(x, y), change x and y by yourself!!!
fig, (ax_m, ax_p) = plt.subplots(
    nrows=2, ncols=1, figsize=(5, 3.5), constrained_layout=True
)
fig.suptitle("Low Pass Filter")
f = np.logspace(0, 3, 1000)

# Magnitude
ax_m.semilogx(f, db(np.abs(model(f))), "b", label="LPF")
ax_m.set_xlim(1e0, 1e3)
ax_m.set_ylabel("Magnitude [dB]")
ax_m.grid(visible=True, which="major")
ax_m.grid(visible=True, which="minor", linestyle=":")
ax_m.legend(loc=1)

# Phase
ax_p.semilogx(f, np.angle(model(f), deg=True), "b", label="LPF")
ax_p.set_xlim(1e0, 1e3)
ax_p.set_ylim(0, 90)
ax_p.set_xlabel("Frequency [Hz]")
ax_p.set_ylabel("Phase [deg]")
ax_p.grid(visible=True, which="major")
ax_p.grid(visible=True, which="minor", linestyle=":")
ax_p.legend(loc=1)

# fig.tight_layout()
fig.savefig("bode-plot@2x.png")